Aura: spend, with receipts.
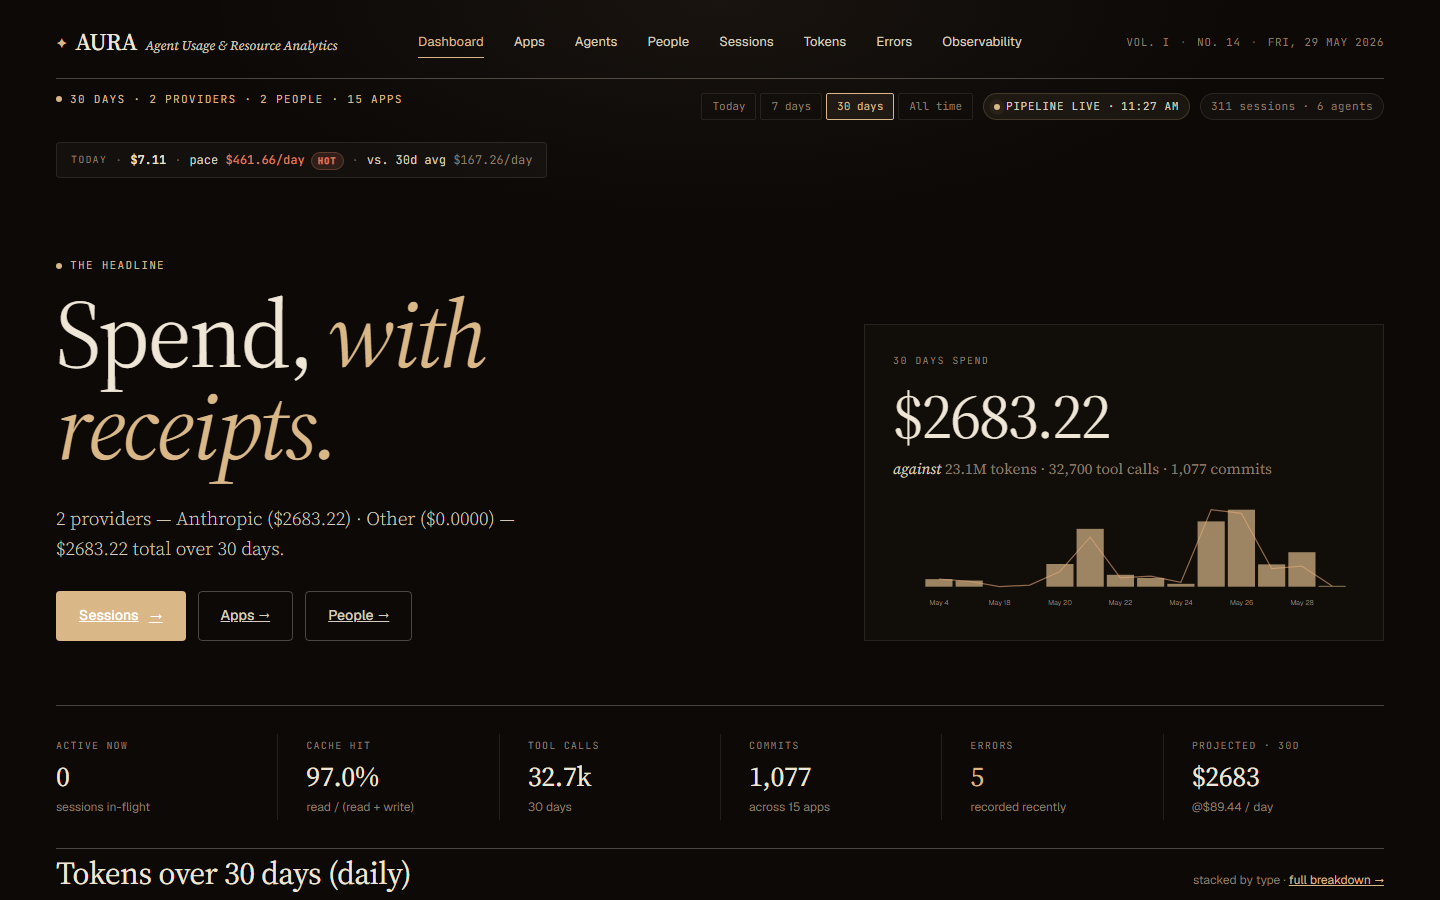
One query against a month of Claude Code transcripts surfaced $2,666 in spend, 32,600 tool calls, and a single agent eating two-thirds of the bill. None of it was visible the day before.
Your agents keep a diary. Nobody reads it.
I ran one query against a month of my own Claude Code transcripts and found I had spent $2,666 in thirty days — 32,600 tool calls, 1,072 commits, a 97% cache-hit rate, and a single agent quietly accounting for two-thirds of the bill. None of that was visible the day before. It was sitting in JSONL files on my disk the whole time, unread.
If you use Claude Code, Cursor, Aider, or any agentic assistant, every session you run is written to disk as a structured log. For Claude Code it is ~/.claude/projects/**/*.jsonl — one line per event: every prompt, every model call with its exact token counts, every tool invocation, every file edit, every error.
It records how you think, what you delegate, where your agents fail, and precisely what each of those things costs. Almost nobody looks at it, because:
- →It is unreadable. Tens of thousands of nested JSON events per day.
- →There is no total. Your provider bill is one number a month later, with no breakdown by project, by agent, by prompt.
- →There is no memory. Once a session scrolls off your terminal, the reasoning and the receipts are gone unless you go spelunking in the raw files.
That gap — between how much your AI coding agent is doing and what you can actually see of it — is the entire reason Aura exists.
A local-first analytics platform. No data leaves your laptop.
Aura is a local-first analytics platform for AI-coding-agent sessions. It watches your transcripts, transforms them with dbt, and surfaces cost, productivity, behavioural, and pipeline-health signals through a Next.js dashboard. Everything runs in Docker on your own machine.
The tagline is spend, with receipts — and that is the design constraint, not just a label. Every dollar Aura shows you is traceable back to the prompt, the model call, and the file edit that produced it. Every page that shows a cost for a given time range reconciles to the same total. No drift between the dashboard and the per-app breakdown and the per-person breakdown. One number, provable from four directions.
Today it speaks fluent Claude Code. Gemini and Codex adapters are next — the architecture was built for more than one provider from day one.
The invoice tells you that you spent. Not where, and not why.
The monthly invoice tells you that you spent money. It never tells you the things you actually need to act on:
Which project burned the budget? Aura splits every dollar by app, project, agent, person, and individual prompt. When I traced my own $2,666, one agent accounted for roughly two-thirds — a number that would have stayed invisible without attribution at the sub-session level.
Did you use a sledgehammer on a thumbtack? Aura's overkill detection scores each prompt on complexity — characters, tool calls, files touched — and compares it to the model tier you used. Fixed a typo with Opus? It gets flagged.
Who is doing the work? When your main agent dispatches a subagent via the Task tool, Aura attributes every event in that window to the real subagent — so technical-writer, frontend-engineer, and code-reviewer show up as distinct rows instead of collapsing into one anonymous claude.
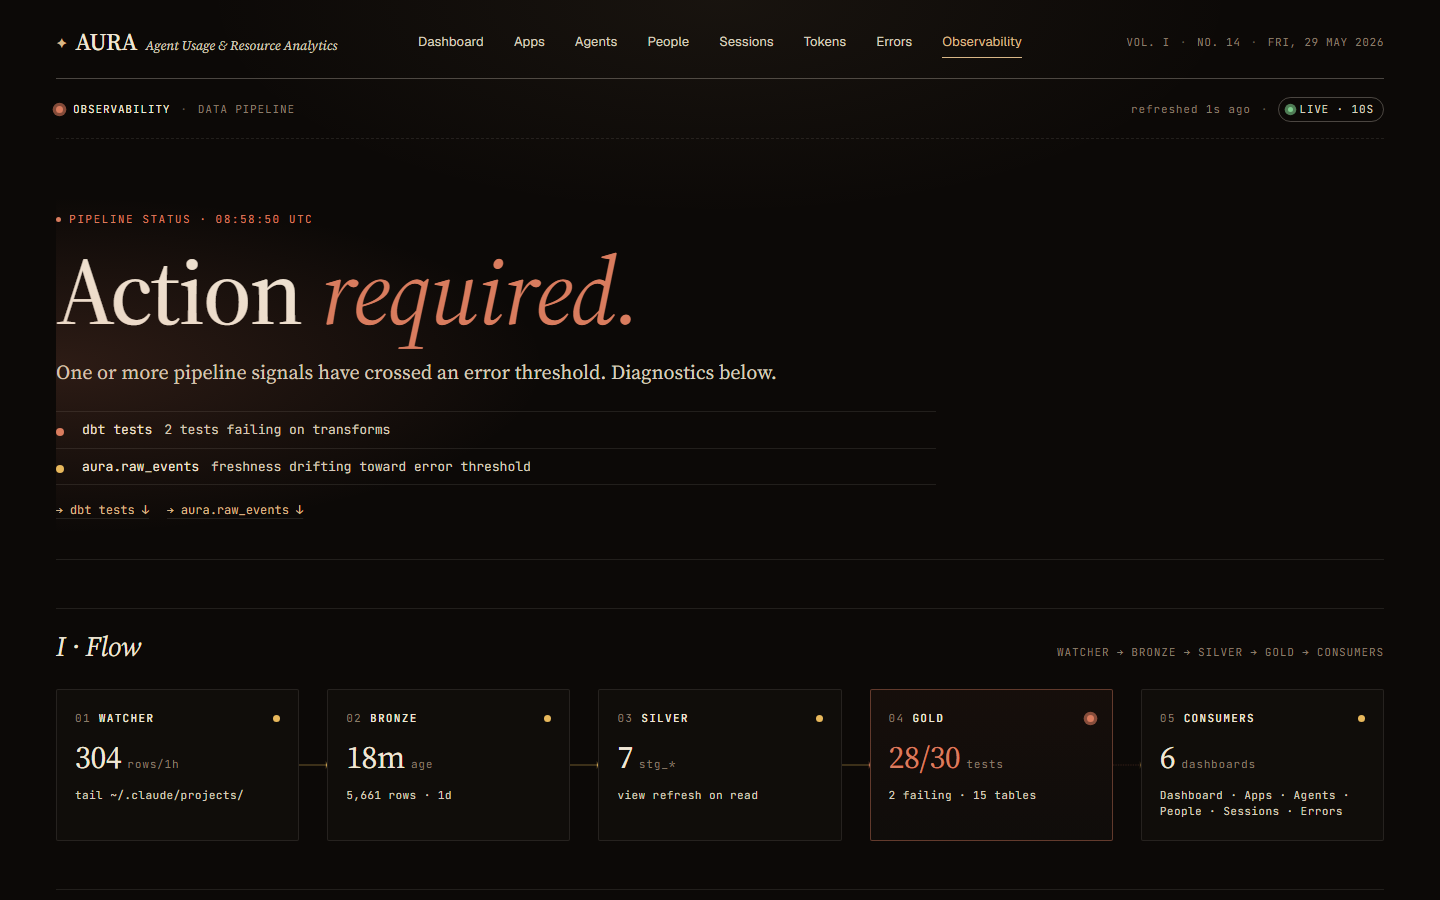
Are the numbers even current? A built-in Observability tab shows ingestion freshness, dbt run status, and watcher failures, so you always know whether what you are looking at is live or stale.
A number is not a receipt. A receipt shows you which prompt, which model, which file.
Deliberately boring on the inside. One file database, three surfaces.
No Kafka, no managed warehouse, no orchestrator. Three small, independent surfaces and a single file database. The architecture:
~/.claude/projects/*.jsonl
        │
        ▼
   watcher (Python)         ──writes──▶   aura.duckdb   (write DB)
   tail + parse + redact                       │
        │                              snapshot every 30s (atomic)
        │ dbt every 5 min                      ▼
        ▼                              read/aura.duckdb  (read snapshot)
   dbt models (DuckDB)                          │
   staging → intermediate → marts               ▼
                                        Next.js 14 dashboard  ·  localhost:3000
The watcher (bronze)
A Python process tails the JSONL files using polling — not inotify, which silently vanishes on Windows and Docker bind-mounts. It parses each line, redacts secrets and base64 blobs, and writes one row to a raw_events table with an INSERT … ON CONFLICT DO NOTHING so re-runs never double-count. On startup it backfills every existing file newest-first, so today's data lands on the dashboard before the historical catch-up finishes.
dbt (silver to gold)
Every five minutes — against whatever is in raw_events right now, never blocking on backfill — dbt rebuilds a clean medallion stack: staging views, intermediate models, and the marts the dashboard reads (fact_model_calls, fact_daily_spend, dim_sessions, fact_prompts, and more). Cost is anchored to the event timestamp, never session-start, so a session that began yesterday and ran into today gets its tokens counted on the correct day. Pricing is SCD-aware: rates carry valid_from and valid_to columns, so historical sessions stay correctly priced after a price change.
The snapshot trick
DuckDB allows one writer at a time. Aura sidesteps the lock by never letting two readers fight the writer. The watcher atomically copies the write DB to a read-only snapshot every 30 seconds; the frontend only ever queries the snapshot. The frontend's connection layer watches the file's inode and transparently reopens when the snapshot is replaced, so it never serves stale data after a refresh. The cost is up to 30 seconds of lag. The win is zero connection contention and a dashboard that never locks up the ingester.
The frontend (Next.js 14, App Router)
Server components read DuckDB directly — almost no API layer. Charts are hand-rolled SVG with no charting library. One time-range model (today / 7d / 30d / all) flows through every page, and ranged queries hit a single pre-aggregated int_entity_spend mart so the totals reconcile everywhere by construction.
The whole thing runs a 200k-event analytics stack on one laptop without an orchestrator.
A tour of the surfaces. All screenshots are from real data.
Dashboard. The headline spend, a KPI strip — cache-hit rate, tool calls, commits, errors, 30-day projection — the daily spend chart, and attribution ledgers for apps, projects, and agents.
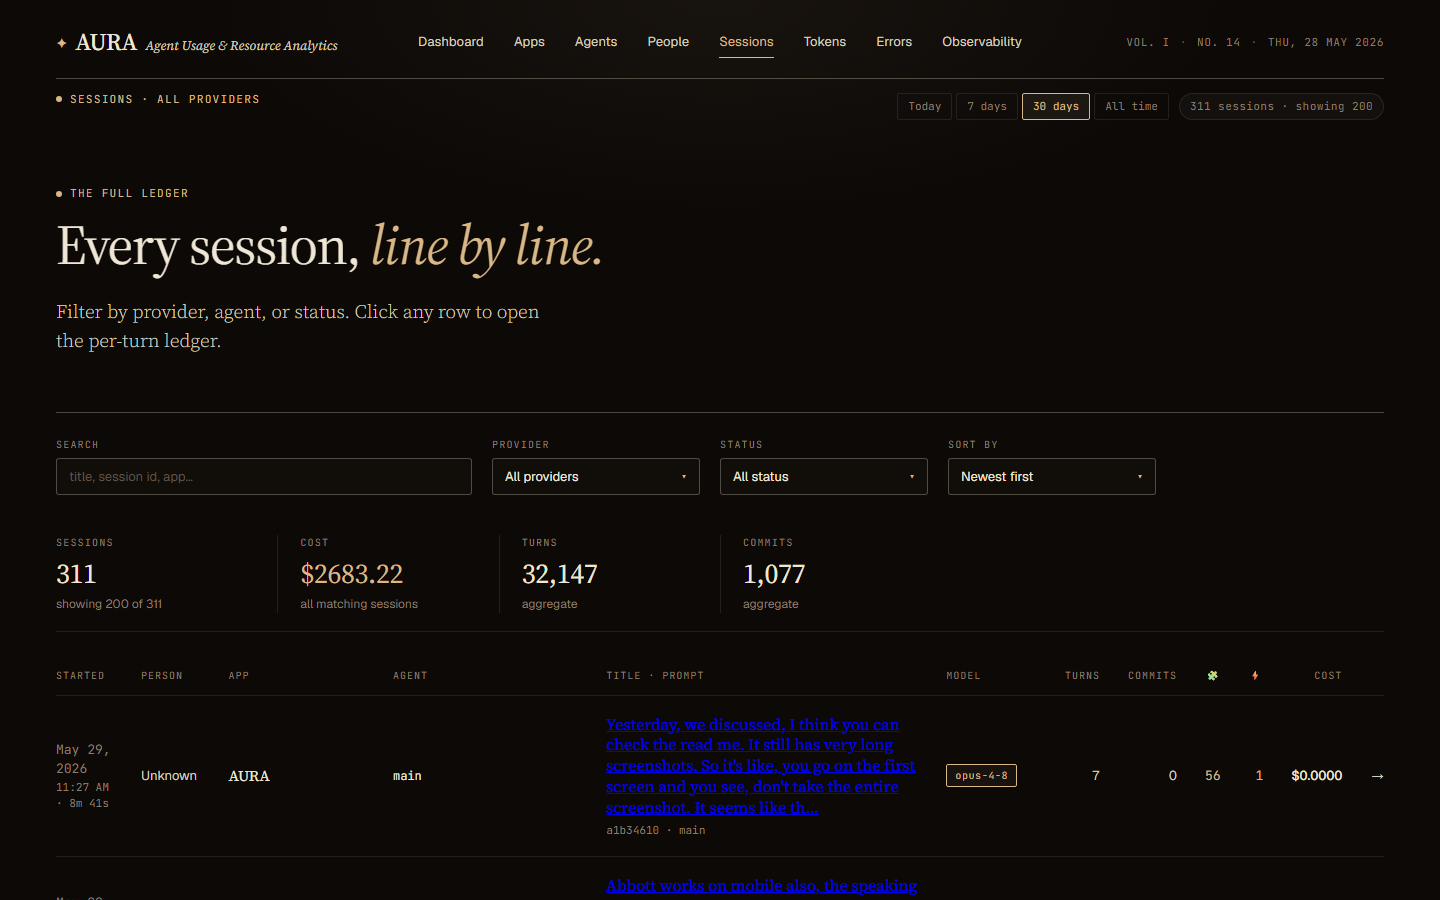
Sessions. A filterable ledger of every session: title, model, turns, cost, person, agent, plus skill and MCP counts. Click one and you land on the per-turn Details view — the full deep-dive, tab by tab.
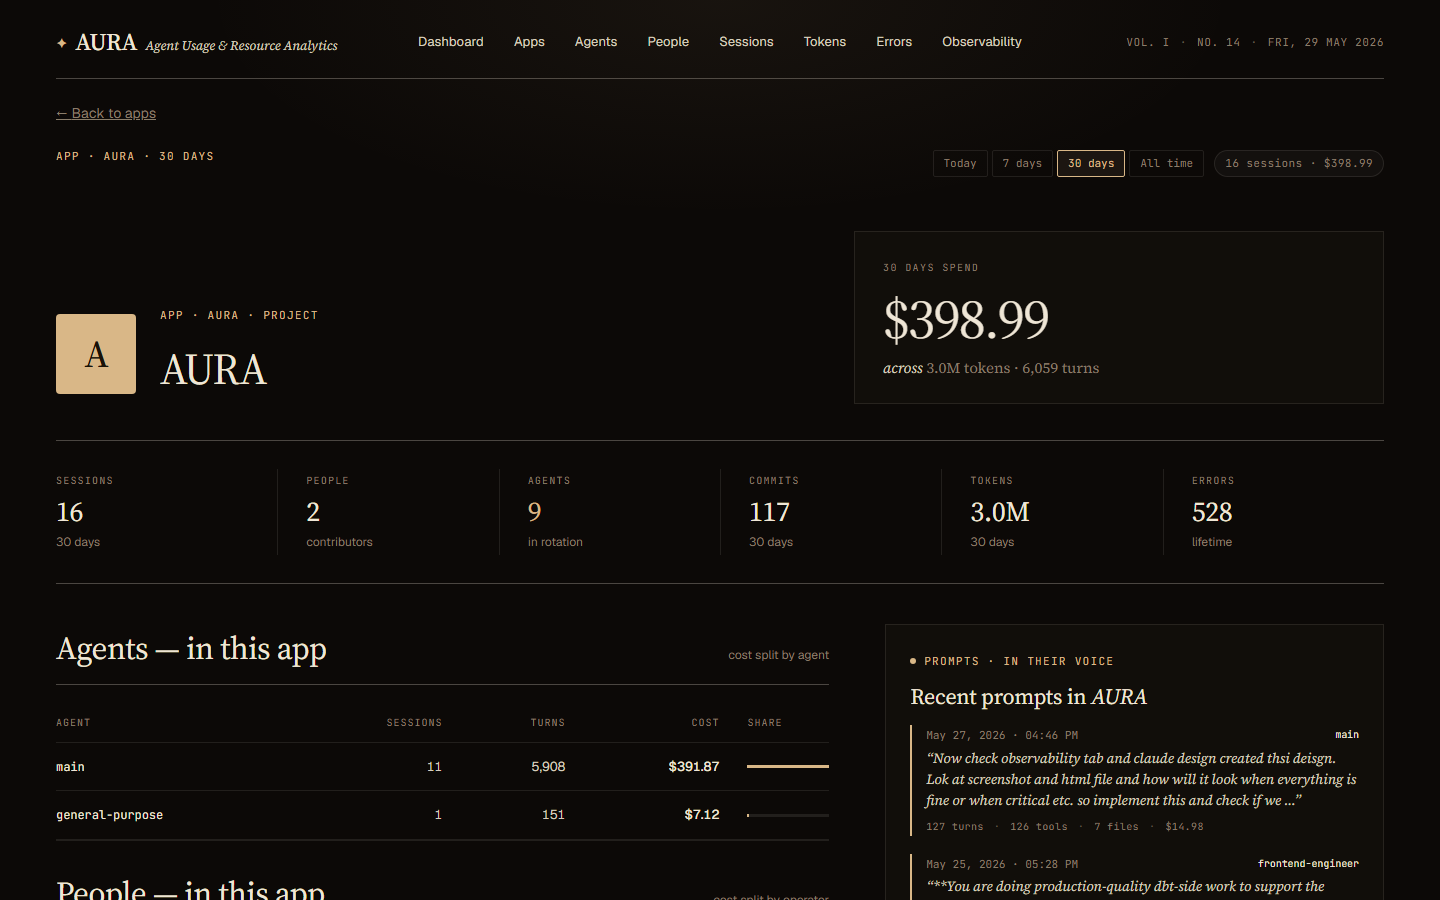
Apps, Agents, People. Every entity gets a roster and a profile page. The app page shows the agents in rotation, the people who worked in it, sibling apps in the project, and a live prompt feed. The agent page shows who delegates to it and the files it touches. The people page shows operator cards with their share of org spend — and what each person actually types.
Tokens. Spend broken out by token type, provider, model, and agent, with a distinct palette per type so cache reads do not blur into output tokens.
Errors. Hard errors, warnings, and tool failures across every session, filterable by kind, tool, and severity.
Observability. The pipeline's own health: a derived verdict, a Watcher to Bronze to Silver to Gold to Consumers flow strip, medallion-layer freshness, source-freshness checks, dbt test results, and the live watcher error feed. It polls every 10 seconds.
Individual or team — the numbers are the same number.
If you are an individual: you get introspection on your own habits. You will find which projects you over-spend on, which prompts you route to a model three tiers too large, and where your agents quietly burn tokens retrying the same failing tool. The first time overkill detection flags a typo fix you ran on a top-tier model, it has paid for the setup time.
If you are a team: you get a shared, honest picture of agent ROI. Cost by person and by project, attribution down to the real subagent, error rates per agent, and a pipeline-health tab so nobody argues about whether the numbers are fresh. Because every cost reconciles to a single source, the dashboard total and the per-person sum are the same number — there is nothing to litigate.
If you care about privacy: everything is local-first. Nothing is shipped anywhere. The path to multi-user is designed around column masking from the start — prompt and response text gets hashed before it would ever leave a machine, so a central store can aggregate cost and token counts without ever seeing what anyone typed.
Simplest thing that works. Edges acknowledged.
Aura is a tool built for one developer first, so the edges are documented rather than papered over.
- It reads Claude Code today. Gemini and Codex are on the roadmap; the pricing seed already has Gemini rows — only the adapter is missing.
- Sessions launched as top-level CLI agents (
claude --agent <name>) roll up undermain, because that identity lives in a system prompt, not a structured field. Delegated subagents viaTaskare attributed correctly. - Every dbt model is a full rebuild, not incremental. At one developer's scale — 100k to 500k events — a rebuild every five minutes finishes in under a minute. Past roughly one million rows you will want incremental facts; the plan is written down in the repo, not yet shipped.
These are deliberate "simplest thing that works" choices. The roadmap is in the repo.
Docker, one command, your data appears.
You need Docker, Docker Compose, and a ~/.claude/projects/ directory with at least one session.
Clone and startbashgit clone https://github.com/darshanmeel/AURA.git
cd AURA
docker-compose up --build
# then open http://localhost:3000
On first boot the watcher starts its snapshot and dbt workers immediately, backfills your existing transcripts newest-first, and hands off to the live poller. The dashboard populates while the historical catch-up is still running.
The dashboard defaults to the today range. If your most recent sessions were yesterday, "today" will look empty — switch to 7d or 30d and the receipts appear. Everything filters on the event date, so an empty "today" means exactly that, not a broken pipeline.
Your agents are already writing everything down. Aura reads it back — with the totals, the attribution, and the receipts that the raw logs never quite hand over on their own.
Aura is MIT-licensed and runs entirely on your machine. Numbers in this post are from the author's own thirty-day Claude Code transcript archive, May 2026. Architecture deep-dive and operator guide are in the repo. — Crosshire